
Limited-Time Offer: Enjoy 50% Savings! Ends in 00h 00m 00s Coupon code: 50OFF
Skip to content

Free Adobe Analytics Business Practitioner Expert AD0-E208 Exam Questions

Page: 1 / 9 Total 50 questions

Want more questions? Get Premium Access.

Question 1

Refer to the exhibit:
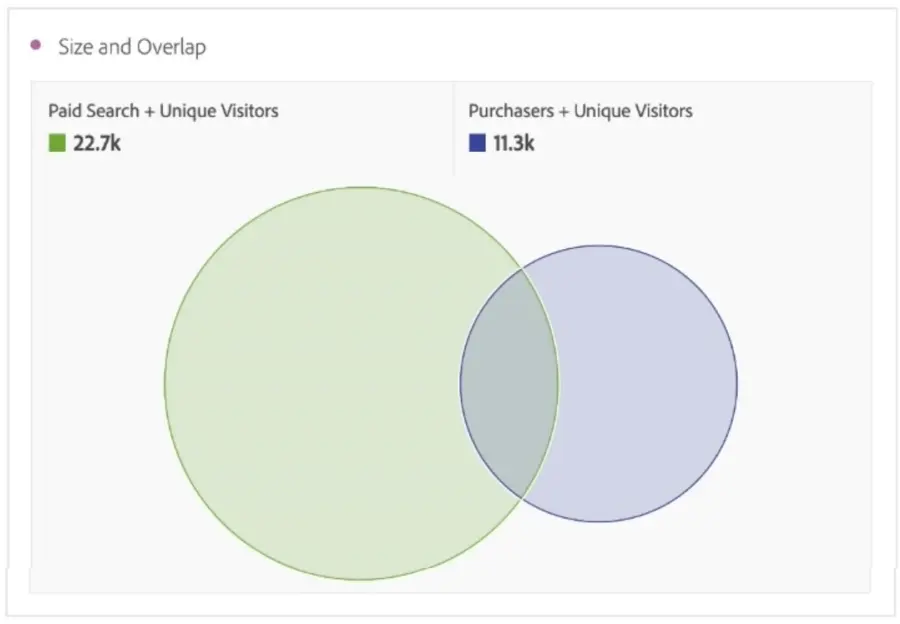
A marketing analyst wants to look into visitors who originated from paid search and made a purchase.

Which two options can be done directly from this Visualization? (Choose two.)

Correct Answer: B. Drag a third segment onto the Venn Visualization to see how it relates to the other two.; C. Right click to create a new segment from the overlap region of the Venn Visualization.
Explanation:

A Venn Visualization is a tool that shows how segments overlap or differ from each other. It can also support up to three segments in one visualization. Two options that can be done directly from this Visualization are: Drag a third segment onto the Venn Visualization to see how it relates to the other two. This will show how the third segment intersects or excludes the other two segments in different regions. Right click to create a new segment from the overlap region of the Venn Visualization. This will create a new segment based on the criteria that match both segments in the overlap region.

References: https://experienceleague.adobe.com/docs/analytics/analyze/analysis-workspace/visualizations/venn.html?lang=en https://experienceleague.adobe.com/docs/analytics/analyze/analysis-workspace/visualizations/venn.html?lang=en#creating-a-segment-from-a-venn-visualization


Question 2

Which option would an analyst choose to show the percentage change between the two numbers in a visualization?

Correct Answer: B. Use the Summary Change visualization, click the Visualization settings, and select Show Percent ,#l Change
Explanation:

The Summary Change visualization shows the difference between two numbers in a report, such as current period vs previous period. To show the percentage change between the two numbers, you need to click the Visualization settings and select Show Percent Change.

References: https://experienceleague.adobe.com/docs/analytics/analyze/analysis-workspace/visualizations/summary-change.html?lang=en


Question 3

A business owner is reviewing quarterly financial data and looks to complete projections for the upcoming quarter.

Which tool should be used to enable this analysis?

Correct Answer: A. Adobe Experience Platform
Explanation:

Adobe Experience Platform is a tool that enables data integration, analysis, and visualization across different sources and channels. It can help business owners to review historical data and create projections for the future.

References: https://experienceleague.adobe.com/docs/experience-platform/landing/home.html?lang=en


Question 4

In the Solution Design Reference document, variable 'Product Category" is assigned to "eVar4" and is set on a product page with value "Shoes". It is then not recorded in the shopping cart page, the "Order summary" page, or the "Order completion" pages.

The variable is configured like this:

If we count the number of orders per product category in a report, which value receives one order after one visitor completes a purchase from that Product page?

Correct Answer: B. Shoes
Explanation:

Since eVar4 is set to expire after purchase event, the value ''Shoes'' will be persisted throughout the visit until the order is completed. Therefore, the report will show one order for product category ''Shoes''.

References: https://experienceleague.adobe.com/docs/analytics/components/variables/conversion-variables/conversion-var-overview.html?lang=en#expiration


Question 5

The web analyst for a beauty products company wants to create a report to analyze the number of sample requests for one of their product pages.

The following items are available from the default configuration:

* prop3, which registers the product page name and is fired in the first page load

* eVar4, which registers the product page name and is fired in the first page load

* event1 2, which fires when a visitor clicks on "Request a sample'' call to action

How can the analyst accomplish the creation of this report?

Correct Answer: C. Use eVar4 in combination with event1 2 as a metric.
Explanation:

The best way to create a report to analyze the number of sample requests for one of their product pages is to use eVar4 in combination with event12 as a metric. eVar4 registers the product page name and is fired in the first page load, so it will capture and persist the value for each visit. event12 fires when a visitor clicks on ''Request a sample'' call to action, so it will measure the number of sample requests. Using eVar4 as a dimension and event12 as a metric will show how many sample requests were made for each product page. Using prop3 instead of eVar4 will not work, as prop3 does not persist across hits or visits.

References: https://experienceleague.adobe.com/docs/analytics/components/variables/conversion-variables/conversion-var-overview.html?lang=en https://experienceleague.adobe.com/docs/analytics/components/variables/traffic-variables/traffic-var-overview.html?lang=en


Question 6

A web analyst is viewing a report in an Analysis Workspace freeform table and sees a dark gray triangle.

What is this specifying in the report?

Correct Answer: C. Data anomaly detected
Explanation:

A dark gray triangle in a report indicates that a data anomaly has been detected for that data point. It means that the value is significantly different from the expected range based on historical data and seasonality.

References: https://experienceleague.adobe.com/docs/analytics/analyze/analysis-workspace/predictive-analytics/anomaly-detection.html?lang=en#anomaly-detection-in-analysis-workspace