
Question 1
Nominal Group Technique is used to:
Correct Answer:
A. help a group reach consensus
Nominal Group Technique is used to:
The following is a set of individual measurements:
3 5 4 5 6 3 4 3 2 4 5 6 5 7 6 4 5 5 8 7 6 6 7 7 4
Find the control limits for the individuals chart.
Aprocess shows the following number of defects. Each sample size for this process is 85. 3 8 2 7 7 6 8 8 9 5 What control chart should be used?
A project whose definition does not include performance metrics:
A control chart will be used to monitor the number of scratches on a product. The following data have been collected:

The appropriate control chart to use is:
An experiment is conducted by checking the effect that three different pressures have on the surface appearance of a product. Ten items are produced at each of the three pressures. The number of replications, factors and levels are:
This table displays the inventory of fasteners in a storage cabinet.
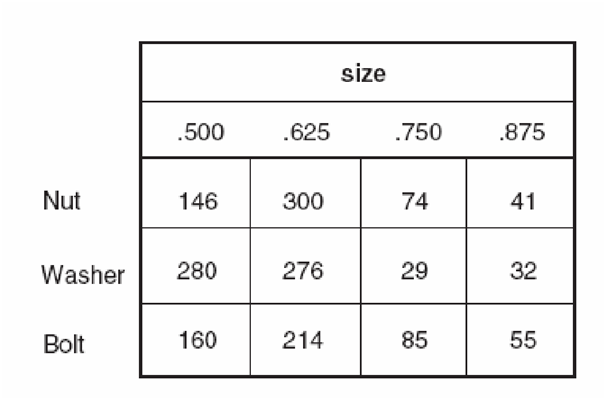
An item is selected at random from the fastener cabinet. Find the approximate probability it is a bolt.
Find Cpk
What is the value of the test statistic?
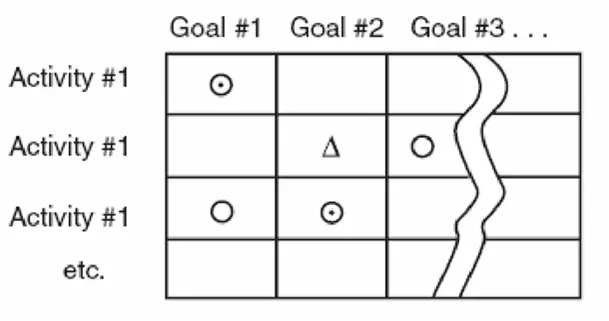
A management team lists nine goals across the top of a rectangle and 15 activity initiatives along the left hand side of the rectangle. If one of the activities strongly supports one of the goals a circle is placed in the box where that activity's row intersects the goal's column. If the activity's support is very strong a ''bulls eye'' is placed in the box and if the support is weak a triangle is used. This best describes which problem solving tool?
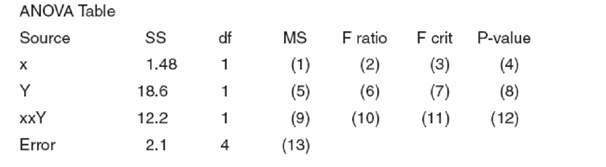
Find the value of (13) in the ANOVA table.
Assume:
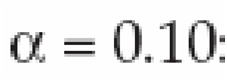
Find the upper control limit for a range chart if n = 4 and the average range
is 2.282.
A team wants to make a schedule for a project showing which tasks must be done sequentially and which may be done simultaneously. Which tool is most appropriate?
A team studies a coil steel banding process and makes five changes resulting in productivity improvements of 2%, 2.8%, 2.4%, 2% and 3% respectively. These improvements are best described by which approach to problem solving?
Approximately what percent of the data values are smaller than the mean?