Limited-Time Offer: Enjoy 50% Savings! Ends in 00h 00m 00s Coupon code: 50OFF
Skip to content

Free Cisco Designing and Implementing Enterprise Network Assurance 300-445 Exam Questions

Page: 1 / 7 Total 68 questions

Want more questions? Get Premium Access.

Question 1

In the IT operations dashboard, what is the alert trigger reason?

Correct Answer: C. Network packet loss
Explanation:

The IT Operations Dashboard includes a section at the beginning that explicitly displays active alert rules and their status. According to the dashboard configuration, the reason for the current alert trigger is Network packet loss. This indicates that the underlying network path for the application is experiencing packet drops exceeding the defined threshold, even if the application layer remains partially functional.


Question 2

You are tasked with creating a ThousandEyes transaction test to monitor the login process of a web application that uses SAML-based SSO with MFA. The MFA step involves a one-time password (OTP) generated by a mobile app. How can you configure the ThousandEyes test to successfully navigate this login process?

Correct Answer: D. Exclude the MFA step from the transaction test and focus only on the SAML login.
Explanation:

In the Designing and Implementing Enterprise Network Assurance (300-445 ENNA) framework, a common architectural hurdle is monitoring applications protected by Multi-Factor Authentication (MFA). ThousandEyes transaction tests utilize automated browser sessions to simulate user behavior, but they face inherent limitations when interacting with 'out-of-band' security mechanisms.

Specifically, ThousandEyes agents cannot natively interact with external hardware tokens, biometric prompts, or mobile-app-based OTP generators (Option A). Since an OTP is dynamic and time-sensitive, manually entering it into a static test configuration (Option B) is impossible for an automated, recurring test. While some complex workhooks (Option C) might theoretically interface with a virtual MFA service, this introduces significant security risks and architectural complexity that is generally discouraged in a standard assurance design.

The verified and most practical approach is to exclude the MFA step from the transaction test and focus only on the SAML login (Option D). For monitoring purposes, IT teams often create a 'synthetic user' account within the Identity Provider (IdP) that is specifically exempted from MFA policies when originating from known ThousandEyes Enterprise Agent IP addresses. This allows the transaction script to validate the availability and performance of the SAML-based SSO redirect, the credential challenge, and the final application landing page. This strategy ensures that the network and application health can be baselined without the test being blocked by a security gate it was never intended to pass.


Question 3

The network team has deployed Webex RoomOS Endpoint Agents and integrated Webex Control Hub with ThousandEyes. The VoIP team wants to know which metrics they can collect from the Webex Control Hub view. Where does the VoIP team find the network data?

Correct Answer: B. Network Path
Explanation:

According to the Designing and Implementing Enterprise Network Assurance (300-445 ENNA) curriculum, the integration between ThousandEyes and Webex Control Hub provides a streamlined troubleshooting experience for collaboration services. For the VoIP team to access the specific ThousandEyes network telemetry---such as latency, loss, and jitter---they must navigate to the Network Path (Option B) section within the Troubleshooting tab of the Control Hub.15

The Network Path visualization is a direct result of the ThousandEyes Endpoint Agent data being pulled into the Webex interface.16 When a user or RoomOS device experiences poor audio or video quality during a meeting, the Control Hub's troubleshooting view displays a 'Network Path' line under the participant's details.17 By clicking on this line, the VoIP team can see a hop-by-hop breakdown of the entire route from the collaboration device to the Webex media node. This view highlights specific hops where performance is 'Poor' (red), 'Fair' (yellow), or 'Good' (green) based on predefined thresholds for latency (>400ms) or loss (>5%).

While 'Devices' (Option A) is where the agents are activated, and 'Users' (Option C) allows for selecting a specific participant, the actual telemetry metrics and the visualization of the network route are strictly located in the Network Path view. This integration eliminates the need for the VoIP team to leave the Webex environment for initial triage, as they can identify if a problem is local to the branch office or deep within a service provider's network directly from the 'Network Path' dashboard.


Question 4

Refer to the exhibit.

An engineer must use Cisco ThousandEyes testing to monitor their Cisco Catalyst SD-WAN fabric. Which SD-WAN component is being monitored by ThousandEyes?

Correct Answer: A. underlay
Explanation:

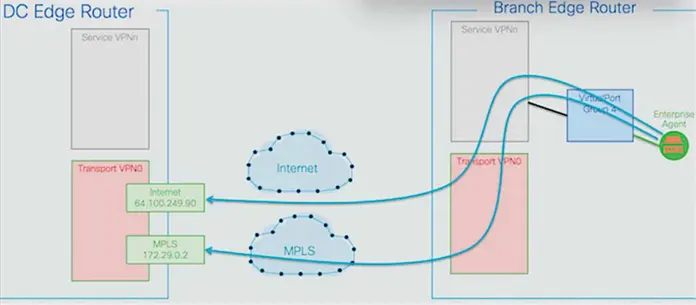
In the Designing and Implementing Enterprise Network Assurance (300-445 ENNA) curriculum, understanding the visibility gap between the SD-WAN overlay and the transport underlay is a core competency. The provided exhibit illustrates a ThousandEyes Enterprise Agent deployed on a Branch Edge Router performing tests across two distinct paths: Internet (reaching a destination at 64.100.249.90) and MPLS (reaching a destination at 172.29.0.2).

According to the ENNA architecture guidelines, ThousandEyes is primarily utilized to provide hop-by-hop visibility into the underlay network. While SD-WAN controllers like vManage provide native monitoring for the overlay---the logical IPsec tunnels (Option B) that form the SD-WAN fabric---they often lack granular visibility into the physical service provider paths (the underlay) that carry those tunnels. The exhibit specifically highlights the agent probing the transport networks (Transport VPN0) directly, bypassing the overlay tunnels to measure the raw performance of the ISP and MPLS circuits.

By monitoring the underlay (Option A), the engineer can identify if high latency or packet loss is caused by a specific hop within the service provider's infrastructure or at a peering point. This 'underlay visibility' is critical for troubleshooting SD-WAN performance issues where the overlay may report a tunnel down, but the root cause lies in a BGP routing change or physical fiber cut in the provider network. ThousandEyes Enterprise Agents, natively integrated into Catalyst 8000 and ISR 4000 platforms, allow for this persistent underlay monitoring without additional hardware.

Overlay (Option C): While ThousandEyes can monitor overlay performance, the exhibit's focus on the raw IP addresses (Internet and MPLS) in the transport VPN indicates an underlay test.

IPsec/GRE Tunnels (Options B & D): These represent the transport mechanisms of the overlay. ThousandEyes probes the path under these tunnels to ensure the transport health is sufficient to support the fabric.


Question 5

SNMP data indicates that a wireless access point is experiencing high channel utilization and increased retransmissions. What optimization would you recommend to improve voice call quality for users on this access point?

Correct Answer: B. Change the access point to a different, less congested channel
Explanation:

In wireless network assurance, high channel utilization and increased retransmissions are clear indicators of RF interference or over-subscription. Retransmissions are particularly damaging to voice call quality because they introduce significant jitter and late-arrival packet loss that the jitter buffer cannot overcome.

The recommended optimization is to change the access point to a different, less congested channel (Option B). This directly reduces the competition for airtime (Channel Utilization) and the likelihood of collisions from neighboring access points (Co-Channel Interference), which in turn lowers the retransmission rate. Modern wireless controllers using Radio Resource Management (RRM) often automate this, but a manual adjustment based on SNMP telemetry is a valid operational fix.

Other options are technically flawed:

Option A: Increasing transmit power often increases interference and channel utilization for surrounding cells, making the problem worse for everyone.

Option C: Disabling all non-voice traffic is an extreme measure that is rarely feasible in a real business environment.

Option D: Admission control limits the number of users but doesn't solve the underlying issue of poor channel health for those already connected.


Question 6

Which type of test are we using for these dashboards (Executive and IT Operations)?

Correct Answer: B. Page Load
Explanation:

According to the Designing and Implementing Enterprise Network Assurance (300-445 ENNA) data analysis guidelines, identifying the underlying test type is the first step in interpreting a dashboard. By observing the metrics displayed across both the Executive and IT Operations dashboards, we can definitively identify the test type as Page Load (Option B).

A Page Load test is a Web-layer test that uses a browser engine (Chromium) to fully render a page and collect advanced metrics beyond simple availability. Evidence for this test type in the dashboards includes:

Page Completion Time: Displayed on the Executive dashboard map, this metric is specific to how much of the page successfully rendered.

DOM Load Time: Found in the IT Operations dashboard, the Document Object Model (DOM) time is a browser-centric metric that measures when the page structure has finished loading.

Waterfall Charts: While not a specific answer option, these are the foundation of Page Load tests, allowing for the timing of individual web components.

Simple HTTP Server tests (Option A) only measure availability and response codes, missing the rendering metrics seen here. Agent to server (Option C) is a network-layer test that provides path visualization but no browser-level data. FTP (Option D) is a protocol-specific test not used for web application monitoring. Therefore, the presence of DOM and Page Completion metrics confirms the Page Load test type.


Question 7

A network administrator wants to establish a baseline for CPU utilization on their core routers. Which data source would be MOST appropriate for this purpose?

Correct Answer: C. SNMP data collected from the routers
Explanation:

In the Designing and Implementing Enterprise Network Assurance (300-445 ENNA) framework, baselining is the process of establishing a 'normal' performance profile for network infrastructure to enable the detection of anomalies. When the metric of interest is the internal health of a physical device, such as CPU utilization on a core router, SNMP (Simple Network Management Protocol) is the industry-standard data source.

SNMP provides direct visibility into the device's control plane and hardware performance. By polling specific Object Identifiers (OIDs) from the router's Management Information Base (MIB), a monitoring system like Cisco Catalyst Center or a third-party NMS can collect granular data on CPU cycles, memory allocation, and temperature. This 'inside-out' telemetry is essential for baselining because it reflects the actual resource consumption of the router during various traffic loads.

Conversely, ThousandEyes tests (Options A, B, and D) provide 'outside-in' synthetic data. While DNS resolution time (Option A), HTTP response times (Option B), and Path Visualization (Option D) are excellent for measuring end-to-end service delivery and network transit health, they do not report on the router's internal hardware state. For instance, a router could have 99% CPU utilization (indicating a potential crash), yet a ThousandEyes path test might still show a 'green' path if the data plane (ASICs) is still forwarding packets efficiently. Therefore, to establish a reliable baseline for hardware-specific metrics like CPU, SNMP data (Option C) is the only appropriate source among the choices.


Question 8

ThousandEyes offers several native integrations for receiving instant event notifications triggered by alerts. Which of the following integrations are available directly within the ThousandEyes platform? Select all that apply.

Correct Answer: A. ServiceNow; B. PagerDuty; C. MS Teams; D. Splunk; F. AppDynamics; G. Webex; H. Slack
Explanation:

According to the Designing and Implementing Enterprise Network Assurance (300-445 ENNA) architecture, ThousandEyes provides a suite of native, 'out-of-the-box' integrations specifically designed for alert notifications. These integrations are configured via the Manage > Integrations or Alert Rules > Notifications tabs and allow the platform to push instant event data to a variety of collaboration, IT operations, and observability tools.

The verified list of native notification integrations includes:

ServiceNow (A): Facilitates direct incident management and automated ticketing workflows.

PagerDuty (B): Allows for automated incident escalation and on-call routing based on ThousandEyes alerts.

MS Teams (C) & Slack (H): Enable real-time chatops by pushing alert details and permalinks directly into specified channels for team collaboration.

Splunk (D): Utilizes the Cisco ThousandEyes App for Splunk to ingest alert data for historical analysis and correlation within a SIEM or logging platform.

AppDynamics (F): Sends alert notifications directly into an AppDynamics instance, allowing application owners to correlate network issues with APM metrics.12

Webex (G): Integrates with the Webex Control Hub and specific Webex spaces to provide unified visibility for collaboration performance.34

AWS (Option E) is not a native alert notification destination 5in this context; instead, ThousandEyes integrates with AWS for 'Cloud Insights' (ingesting VPC Flow Logs) and 'Test Recommendations' rather than acting as a receiver for event notifications like a chat or ITSM tool. By utilizing these native integrations, enterprise teams ensure that the right stakeholders are notified through their preferred communication channels the moment a performance threshold is breached, drastically improving response times across the organization.

Question 9

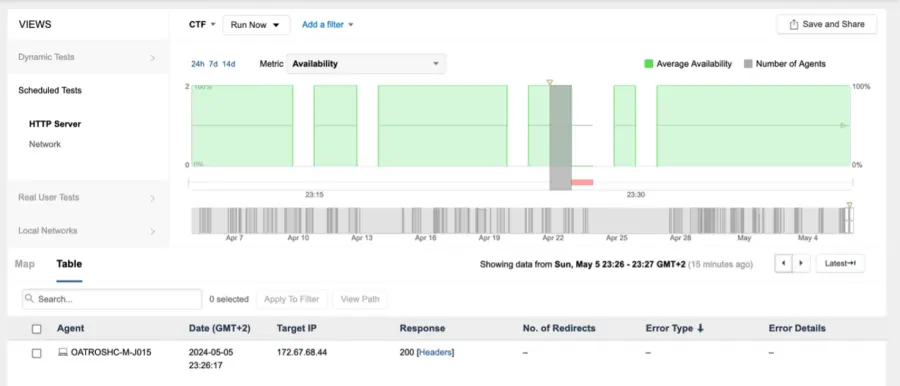
Refer to the exhibits.

The endpoint has the following IP credentials:

192.168.100.9/24, DNS: 8.8.8.8, 8.8.4.4, GW: 192.168.100.1

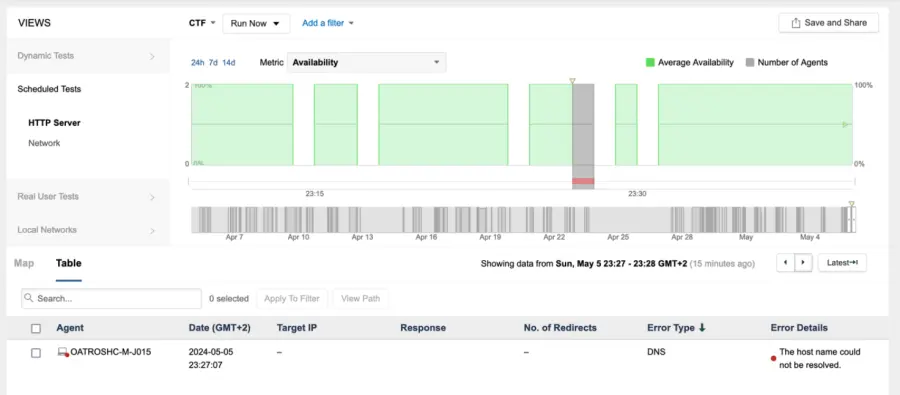
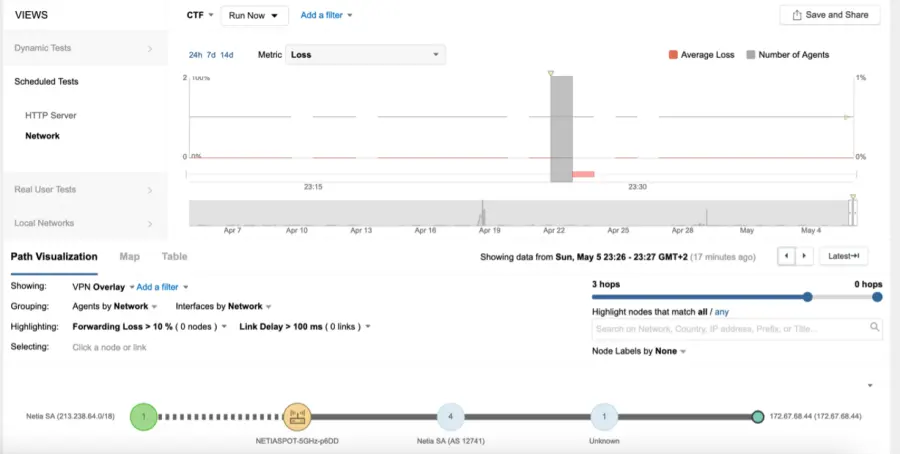
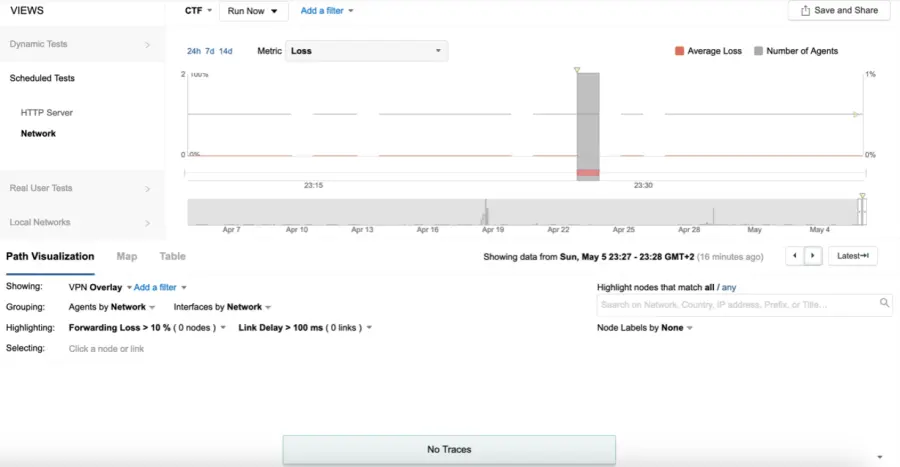
Based on the views presented in the exhibits, what led to the error occurring on Sun, May 5 23:27 GMT +2?

Correct Answer: C. The DNS servers assigned to the endpoint are unreachable.

Question 10

What is the primary purpose of integrating ThousandEyes with Meraki?

Correct Answer: B. To monitor external applications and services from SD-WAN sites
Explanation:

The Designing and Implementing Enterprise Network Assurance (300-445 ENNA) framework highlights the integration between ThousandEyes and Cisco Meraki as a solution for 'cross-domain assurance'.5 The primary purpose of this integration is to monitor external applications and services from SD-WAN sites (Option B).

In a distributed Meraki environment, IT teams often struggle with visibility into the 'Internet as a WAN,' where performance issues may occur outside the local network perimeter. By embedding ThousandEyes Enterprise Agents natively within Meraki MX appliances, organizations can bridge the gap between internal LAN metrics and external service health.6 This integration allows for proactive monitoring of SaaS platforms (like Microsoft 365, Salesforce, and Webex) and other public-facing dependencies using synthetic probes. It complements the native Meraki Insight (MI), which provides passive monitoring of real user traffic, by adding active path visualization and hop-by-hop analysis across the Internet.

Key advantages of this integration include:

One-Click Activation: Enabling the ThousandEyes agent directly from the Meraki Dashboard without additional hardware.7

Pre-configured Templates: Using built-in test templates for common SaaS applications to accelerate troubleshooting.8

Isolation of Fault Domains: Quickly determining if a user's lag is caused by a local Wi-Fi issue (via Meraki wireless metrics) or an ISP routing problem (via ThousandEyes path data).9

While ThousandEyes does provide visibility for VPN and security, Options A, C, and D are not the primary focus of the specific Meraki-ThousandEyes integration architecture, which is centered on extending application performance assurance to distributed branch locations.