Limited-Time Offer: Enjoy 50% Savings! Ends in 00h 00m 00s Coupon code: 50OFF
Skip to content

Free Oracle Database 19c: Performance Management and Tuning 1Z0-084 Exam Questions

Page: 1 / 6 Total 55 questions

Want more questions? Get Premium Access.

Question 1

Which three statements are true about server-generated alerts?

Correct Answer: A. They are notifications from the Oracle Database Server of an existing or impending problem.; C. They are logged in the alert log.; F. They may contain suggestions for correcting the identified problems.
Explanation:

Server-generated alerts in Oracle Database are designed to notify DBAs and other administrators about issues within the database environment. These alerts can be triggered by a variety of conditions, including threshold-based metrics and specific events such as ORA- error messages. Here's how these options align with the statements provided:

A (True): Server-generated alerts are indeed notifications from the Oracle Database Server that highlight existing or impending issues. These alerts are part of Oracle's proactive management capabilities, designed to inform administrators about potential problems before they escalate.

C (True): These alerts are logged in the alert log of the Oracle Database. The alert log is a crucial diagnostic tool that records major events and changes in the database, including server-generated alerts. This log is often the first place DBAs look when troubleshooting database issues.

F (True): Server-generated alerts may include suggestions for correcting identified problems. Oracle Database often provides actionable advice within these alerts to assist in resolving issues more efficiently. These suggestions can range from adjusting configuration parameters to performing specific maintenance tasks.

Options B, D, and E do not accurately describe server-generated alerts:

B (False): While the statement might have been true in some contexts, Oracle's server-generated alerts often include corrective suggestions, making this statement incorrect.

D (False): Server-generated alerts can be viewed from various interfaces, not just the Cloud Control Database home page. They are accessible through Enterprise Manager, SQL Developer, and directly within the database alert log, among other tools.

E (False): While it's true that threshold settings for some alerts can be modified, the method specified, using DBMS_SERVER_ALERT, is not correct. Threshold settings are typically adjusted through Enterprise Manager or by modifying specific initialization parameters directly.


Oracle Database Documentation: Oracle Database 19c: Performance Management and Tuning

Oracle Base: Alert Log and Trace Files

Oracle Support: Understanding and Managing Server-Generated Alerts

Question 2

Which two actions can cause invalidation or loss of one or more results in the SQL Query Result Cache?

Correct Answer: A. One or more results were aged out of the result cache.; B. result_cache_max_size is set dynamically to 0.
Explanation:

The SQL Query Result Cache stores the results of queries and PL/SQL function calls for reuse. However, entries in the result cache can be invalidated or lost under certain conditions:

A) Results can be aged out of the cache when the cache becomes full and new results need to be stored. This process ensures that the cache does not exceed its allocated memory and that it contains the most recently used entries.

B) Setting the RESULT_CACHE_MAX_SIZE parameter to 0 will effectively disable the result cache and all cached results will be lost, as Oracle will no longer allocate any memory to the result cache.


Oracle Database Performance Tuning Guide, 19c

Question 3

Which two types of performance problems are reported by ADDM for PDBS?

Correct Answer: A. I/O capacity limits; E. User I/O waits
Explanation:

The Automatic Database Diagnostic Monitor (ADDM) analyzes and reports on various types of performance problems. For Pluggable Databases (PDBs), it can identify issues such as I/O capacity limits which may hinder the overall performance by causing bottlenecks. Additionally, ADDM can report on user I/O waits, which can indicate performance issues related to the time it takes for user queries to read data from the disk.


Oracle Multitenant Administrator's Guide, 19c

Oracle Database Performance Tuning Guide, 19c

Question 4

You use SQL Tuning Advisor to tune a given SQL statement.

The analysis eventually results in the implementation of a SQL Profile.

You then generate the new SQL Profile plan and enforce it using a SQL Plan Baseline but forget to disable the SQL Profile and a few days later you find out that the SQL Profile is generating a new execution plan.

Which two statements are true?

Correct Answer: C. The execution plan is the one enforced by the SQL Profile.; E. The SQL Plan Baseline must be accepted in order to be used for the execution plan.
Explanation:

When both a SQL Profile and a SQL Plan Baseline are in place, the SQL Profile has a stronger preference and the optimizer is more likely to choose the execution plan from the SQL Profile.

C) A SQL Profile is generally more influential than a SQL Plan Baseline because it contains additional statistics and directives that help the optimizer to generate a more efficient execution plan. If both exist, the optimizer will use the profile's plan unless the baseline's plan is proven to be better through the SQL performance monitoring process.

E) SQL Plan Baselines must be accepted before they can be used by the optimizer. If a SQL Plan Baseline is not accepted, it will not be considered for generating the execution plan. Therefore, the presence of an unaccepted SQL Plan Baseline will not automatically force the optimizer to use its plan.


Oracle Database SQL Tuning Guide, 19c

Oracle Database Administrator's Guide, 19c

Question 5

You must write a statement that returns the ten most recent sales. Examine this statement:

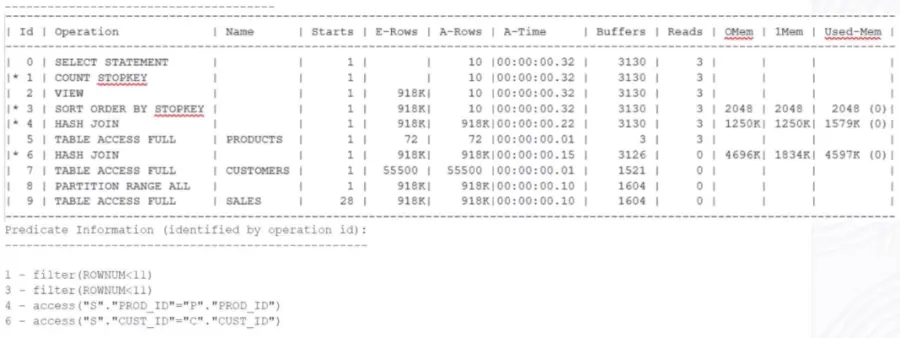
Users complain that the query executes too slowly. Examine the statement's current execution plan:

What must you do to reduce the execution time and why?

Correct Answer: A. Create an index on SALES.TIME_ID to force the return of rows in the order specified by the ORDER BY clause.
Explanation:

The execution plan shows a full table access for the SALES table. To reduce the execution time, creating an index on SALES.TIME_ID would be beneficial as it would allow the database to quickly sort and retrieve the most recent sales without the need to perform a full table scan, which is I/O intensive and slower. By indexing TIME_ID, which is used in the ORDER BY clause, the optimizer can take advantage of the index to efficiently sort and limit the result set to the ten most recent sales.

B (Incorrect): Replacing FETCH FIRST with ROWNUM would not necessarily improve the performance unless there is an appropriate index that the optimizer can use to avoid sorting the entire result set.

C (Incorrect): There is no indication that the current statistics are inaccurate; hence, collecting new statistics may not lead to performance improvement.

D (Incorrect): While adaptive plans can provide performance benefits by allowing the optimizer to adapt the execution strategy, the main issue here is the lack of an index on the ORDER BY column.

E (Incorrect): Creating an index on SALES.CUST_ID could improve join performance but would not address the performance issue caused by the lack of an index on the ORDER BY column.


Oracle Database SQL Tuning Guide: Managing Indexes

Oracle Database SQL Tuning Guide: Using Indexes and Clusters

Question 6

You need to transport performance data from a Standard Edition to an Enterprise Edition database. What is the recommended method to do this?

Correct Answer: D. Export the data by using the exp utility and parameter file spuexp.par from the Statspack repository and import it by using imp into a dedicated Statspack schema on the destination.
Explanation:

To transport performance data from an Oracle Database Standard Edition, which uses Statspack, to an Enterprise Edition database, which uses AWR, you must consider the compatibility of data structures and repository schemas between these tools. The recommended method is:

D (Correct): Export the data using the exp utility with a parameter file appropriate for Statspack (like spuexp.par) from the Statspack repository and import it into a dedicated Statspack schema on the destination. Since Statspack and AWR use different schemas, it's not recommended to import Statspack data directly into the AWR repository.

The other options are incorrect because:

A (Incorrect): expdp is not designed to export from Statspack, and awrload is intended for loading from an AWR export file, not a Statspack export.

B (Incorrect): Although expdp and impdp are used for exporting and importing data, the AWR repository schema is different from the Statspack schema, so importing Statspack data directly into the AWR repository is not recommended.

C (Incorrect): Using expdp to export from Statspack and then importing directly into the AWR repository is not the correct approach due to the schema differences between Statspack and AWR.


Oracle Database Performance Tuning Guide: Migrating from Statspack to AWR

Question 7

18. The application provider has given full indications regarding the procedure to collect statistics.

To reduce the space used in the SYSAUX tablespace, you want to prevent the optimizer statistics Advisor from running.

Which method will allow you to do this?

Correct Answer: B. Use DBMS_AUTO_TASK_ADMIN. DISABLE to disable the AUTO_STATS_ADVISOR_TASK task.
Explanation:

The Oracle Optimizer statistics advisor, which is part of the automated tasks framework, can be disabled using the DBMS_AUTO_TASK_ADMIN package. This will prevent it from running and thus reduce space usage in the SYSAUX tablespace. Reference:

Oracle Database PL/SQL Packages and Types Reference, 19c


Question 8

You are informed that the RMAN session that is performing the database duplication is much slower than usual. You want to know the approximate time when the rman operation will be completed.

Which view has this information?

Correct Answer: D. V$SESSION_LONGOPS
Explanation:

In Oracle Database, the V$SESSION_LONGOPS view provides insights into various operations within the database that are expected to take more than six seconds to complete. These include operations related to RMAN (Recovery Manager), such as database duplication tasks. This view displays information about the progress of these long-running operations, including the start time, elapsed time, and estimated time to completion.

When an RMAN session is performing a database duplication and is observed to be slower than usual, checking the V$SESSION_LONGOPS view can give an approximation of when the RMAN operation might complete. This view includes fields like TIME_REMAINING and ELAPSED_SECONDS that help in estimating the completion time of the operation based on its current progress.


Oracle Database Reference: V$SESSION_LONGOPS

Oracle Database Backup and Recovery User's Guide: Monitoring RMAN Jobs

Question 9

Which three types of statistics are captured by statspack with snap level 6?

Correct Answer: A. Parent and child latches; E. Enqueue statistics; F. Segment-level statistics
Explanation:

Statspack is a performance diagnostic tool provided by Oracle prior to the introduction of the Automatic Workload Repository (AWR). At snap level 6, Statspack captures the following types of statistics:

A (Correct): Parent and child latches are captured. Latch statistics provide information about contention for latches, which are low-level serialization mechanisms used by Oracle.

E (Correct): Enqueue statistics, which provide information on the waits for locks that manage the concurrency between users.

F (Correct): Segment-level statistics, which provide detailed information on database segments such as tables, indexes, etc., to identify I/O and contention issues.

C (Incorrect): While optimizer execution plans are an essential aspect of performance tuning, detailed execution plan capture is not part of the Statspack report at level 6.

D (Incorrect): Plan usage data refers to how frequently a plan is being used, which is more associated with AWR and not typically captured in Statspack reports.


Oracle Database Performance Tuning Guide: Using Statspack

Question 10

Database performance degraded between 23:15 and 23:30 for the last three nights. The awr snapshot interval is one hour. The AODM report contains nothing about this performance problem.

With which tool can you further analyze this problem?

Correct Answer: D. Active Session History report
Explanation:

The Active Session History (ASH) report is a tool that provides detailed information about active sessions for the time period specified. Since the AWR snapshot interval is one hour and does not capture the granularity needed for this issue, ASH reports are more suitable as they contain more granular data for sessions that were active during the period of interest.


Oracle Database Performance Tuning Guide, 19c