
Limited-Time Offer: Enjoy 50% Savings! Ends in 00h 00m 00s Coupon code: 50OFF
Skip to content

Free Qlik QlikView 12 Business Analyst Certification Exam QV12BA Exam Questions

Page: 1 / 9 Total 50 questions

Want more questions? Get Premium Access.

Question 1

A data architect needs to develop a dashboard to represent the previous year's sales performance in a simple KPI object Which expression should be used to calculate this value?

Correct Answer: A. Sum({<Year={$(=Max(Year)-I)}>}Sales)
Question 2

A business analyst needs to create a dashboard showing only numerical values. There is NO need to filter data or select any

dimensions.

Which three objects can the business analyst use? (Select three )

Correct Answer: A. Bar chart; B. Grid chart; C. Gauge chart

Question 3

A business analyst needs to sort the values for the Product dimension explicitly as "Planes", then "Trains", then "Automobiles" The analyst needs a highly optimized solution to provide the best performance for an application with between 900 million and 1 billion records

Which solution should the analyst use?

Correct Answer: C. Create a new calculated dimension in the Ul named ProductSort, then sort the Product field by the new ProductSort field

Question 4

An Invoices table has a DaysOverdue field A chart is required to analyze overdue invoices in 30 day intervals Which function should a business analyst use to meet this requirement?

Correct Answer: B. Class(DaysOverdue, 30)

Question 5

A business analyst creates a document with sales data for different regions, products, and salespeople. The analyst needs to create an object that will show the percentage of the total sales when one or more values are selected.

Which two objects can the analyst use to meet these requirements? (Select two.)

Correct Answer: A. Text box; B. Table box

Question 6

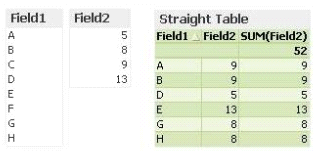
Refer to the exhibit.

The straight table does NOT show all rows from the Field1 list box What does this indicate about the dataset?

Correct Answer: A. Field2 is a synthetic key