
Limited-Time Offer: Enjoy 50% Savings! Ends in 00h 00m 00s Coupon code: 50OFF
Skip to content

Free Salesforce Certified Tableau Consultant Analytics-Con-301 Exam Questions

Page: 1 / 10 Total 100 questions

Want more questions? Get Premium Access.

Question 1

A client wants to report Saturday and Sunday regardless of the workbook's data source's locale settings.

Which calculation should the consultant recommend?

Correct Answer: D. DATEPART('iso-weekday', [Order Date])=1 or DATEPART('iso-weekday', [Order Date])=7
Explanation:

The calculation DATEPART('iso-weekday', [Order Date])=1 or DATEPART('iso-weekday', [Order Date])=7 is recommended because the ISO standard considers Monday as the first day of the week (1) and Sunday as the last day (7). This calculation will correctly identify Saturdays and Sundays regardless of the locale settings of the workbook's data source, ensuring that the report includes these days as specified by the client.


To accurately identify weekends across different locale settings, using the 'iso-weekday' component is reliable as it is consistent across various locales:

ISO Weekday Function: The ISO standard treats Monday as the first day of the week (1), which makes Sunday the seventh day (7). This standardization helps avoid discrepancies in weekday calculations that might arise due to locale-specific settings.

Identifying Weekends: The calculation checks if the 'iso-weekday' part of the date is either 1 (Sunday) or 7 (Saturday), thereby correctly identifying weekends regardless of the locale settings.

Handling Locale-Specific Settings: Using ISO standards in date functions allows for uniform results across systems with differing locale settings, essential for consistent reporting in global applications.
Question 2

A consultant wants to improve the performance of reports by moving calculations to the data layer and materializing them in the extract.

Which type of calculation is the consultant able to move?

Correct Answer: A. A row-level calculation
Explanation:

Comprehensive and Detailed Explanation From Exact Extract:

Tableau allows certain calculations to be materialized in extracts, meaning they are precomputed and stored inside the .hyper file to improve performance.

According to Tableau's extract documentation:

Materializable calculations must be compatible with the extract engine and must not depend on dynamic, view-based, or post-query logic.

Only row-level calculations and aggregation-level calculations without dependencies on runtime context can be materialized.

Tableau cannot materialize any calculation containing:

Table calculation functions

Functions requiring post-aggregation logic

View-dependent elements

Parameters that need runtime evaluation

Evaluation of the choices:

A . A row-level calculation --- Correct

Row-level calculations operate on each record individually before aggregation.

Tableau documentation specifies that these calculations can be pushed down into the extract and materialized because they do not depend on the visualization or user interaction.

Examples include concatenation, arithmetic, string manipulation, and row-based logic such as:

[Sales] * [Quantity] or IF [Region] = 'West' THEN 1 END

These can be precomputed inside the extract, improving performance.

B . A calculation that contains table calculation functions --- Not allowed

Table calculations (WINDOW_SUM, INDEX, RUNNING_SUM, RANK, etc.) depend on the table structure after aggregation and query execution.

Therefore, Tableau documentation states they cannot be materialized in extracts.

C . A calculation that contains parameters --- Not allowed

Parameters are evaluated at runtime, meaning the user can change their value.

Because of this, Tableau cannot permanently compute and store such a calculation inside an extract.

D . A calculation that contains an aggregation --- Generally not materialized

Aggregated calculations often depend on query context and cannot always be materialized.

Only simple, context-free aggregations might be materialized, but Tableau explicitly warns that aggregations are not guaranteed candidates for extract materialization.

Thus, this is not the best answer compared to row-level logic.

Conclusion

Only row-level calculations meet Tableau's exact requirements for materialization in extracts.

Reference From Tableau Consultant Documentation

Tableau Extract documentation describing materializable calculation types.

Tableau guidance stating table calculations and parameter-dependent calculations cannot be materialized.

Extract optimization guidelines describing row-level logic as eligible for materialization.


Question 3

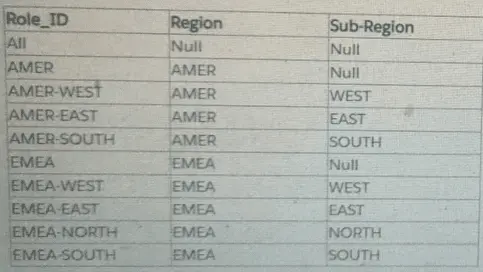
A Tableau consultant is tasked with choosing a method of setting up row-level security (RLS) entitlements with tables during a Tableau implementation. The consultant has received a set of roles from a client in one normalized table, and a set of entitlements from the client in another normalized table.

The consultant plans on using the deepest granularity method. However, when the consultant gains access to the final set of data, they discover duplicate values at the lowest level. Most of the regions in the client's dataset contain sub-regions named 'East' and 'West'. However, some regions have a 'Null' value for sub-region.

How should the consultant proceed?

Correct Answer: C. Use sparse entitlements because it defines entitlements at every level of the hierarchy and can handle duplicate values in the dataset.
Explanation:

Comprehensive and Detailed Explanation From Exact Extract:

Tableau's RLS entitlement design patterns include:

1. Deepest Granularity Method

Requires one unique role one unique lowest-level value pairing.

Fails when the dataset contains duplicate lowest-level values (e.g., multiple ''East'' sub-regions across different regions).

Cannot operate correctly when some lowest-level values are NULL.

Thus, the deepest granularity method is not valid here.

2. Sparse Entitlements Method

Tableau documentation states:

Sparse entitlements define RLS at each level of the hierarchy instead of only at the lowest level.

This method supports duplicate lowest-level values.

Handles scenarios where some levels are NULL because higher-level entitlements (e.g. Region = AMER) can still correctly apply.

More flexible for hierarchical geographic structures (Region Sub-Region Country, etc.).

Given the client's dataset:

Multiple ''East'' and ''West'' sub-regions

Some ''Null'' sub-regions

Hierarchical levels present

Sparse entitlements is the only correct and supported choice.

Why the incorrect options are wrong:

A & B --- Deepest Granularity

Deepest granularity fails when the lowest-level values are not unique.

It cannot handle NULL values at the lowest tier.

Performance is not superior in this scenario.

D --- Sparse because it is most performant

Performance is not the defining advantage.

Flexibility and ability to handle duplicate lowest-level values is.

Thus, C is the correct statement.

RLS entitlement design patterns: deepest vs. sparse entitlements.

Rules requiring unique lowest-level identifiers for deepest granularity.

Guidance stating sparse entitlements should be used when duplicates or NULL values exist in hierarchical structures.


Question 4

A client is concerned that a dashboard has experienced degraded performance after they added additional quick filters. The client asks a consultant to improve performance.

Which two actions should the consultant take to fulfill the client's request? Choose two.

Correct Answer: A. Modify filters to include an 'Apply' button.; D. Use Filter Actions instead of quick filters.
Explanation:

Comprehensive and Detailed Explanation From Exact Extract:

Quick filters are one of the most expensive features in Tableau because they require queries to populate value lists and dynamic recalculations when filters change.

According to Tableau performance documentation:

1. Add an ''Apply'' Button

This prevents Tableau from re-running queries every time the user selects a filter value.

Queries are executed once when the user presses Apply.

This is a documented best practice for filter-heavy dashboards.

2. Replace Quick Filters with Filter Actions

Filter actions are far more efficient because:

They leverage the existing view context

They do not require separate filter UI queries

They avoid the overhead of quick filter value lists

Tableau recommends using filter actions instead of multiple quick filters for better performance.

Why the other options are incorrect:

B . Add filters to Context: Context filters make downstream filters faster, but do not reduce quick filter processing cost; they can even increase extract size and slow down the dashboard.

C . Only Relevant Values: This actually slows performance because Tableau must re-evaluate the entire data set to determine relevancy every time filters update.

Thus, A and D are the correct performance-improvement approaches.

Tableau Performance Checklist recommending Apply button for multi-select filters.

Performance documentation advising the use of Filter Actions over multiple quick filters.

Filtering best practices explaining the cost of Only Relevant Values.


Question 5

A client builds a dashboard that presents current and long-term stock measures. Currently, the data is at a daily level. The data presents as a bar chart that

presents monthly results over current and previous years. Some measures must present as monthly averages.

What should the consultant recommend to limit the data source for optimal performance?

Correct Answer: B. Limit data to current and previous years, move calculating averages to data layer, and aggregate dates to monthly level.
Explanation:

For optimal performance, it is recommended to limit the data to what is necessary for analysis, which in this case would be the current and previous years. Moving the calculation of averages to the data layer and aggregating the dates to a monthly level will reduce the granularity of the data, thereby improving the performance of the dashboard. This approach aligns with best practices for optimizing workbook performance in Tableau, which suggest simplifying the data model and reducing the number of records processed12.


Question 6

A company has a data source for sales transactions. The data source has the following characteristics:

. Millions of transactions occur weekly.

. The transactions are added nightly.

. Incorrect transactions are revised every week on Saturday.

* The end users need to see up-to-date data daily.

A consultant needs to publish a data source in Tableau Server to ensure that all the transactions in the data source are available.

What should the consultant do to create and publish the data?

Correct Answer: A. Publish an incremental extract refresh every day and perform a full extract refresh every Saturday.
Explanation:

Given the need for up-to-date data on a daily basis and weekly revisions, the best approach is to use an incremental extract refresh daily to update the data source with new transactions. On Saturdays, when incorrect transactions are revised, a full extract refresh should be performed to incorporate all revisions and ensure the data's accuracy. This strategy allows end users to have access to the most current data throughout the week while also accounting for any necessary corrections12.


Question 7

A customer wants to leverage generative AI capabilities. The customer is currently on Tableau Server 2023.1.

How is the customer able to leverage generative AI in Tableau?

Correct Answer: B. Migrate Tableau Server to Tableau Cloud.
Explanation:

Comprehensive and Detailed Explanation From Exact Extract:

Tableau's official generative AI capability---Tableau Pulse and Einstein-powered Tableau AI features---are available only on Tableau Cloud, not Tableau Server.

Key Tableau facts:

Tableau Server (any version, including new ones) does not provide generative AI capabilities.

Tableau Cloud includes AI features such as:

Tableau Pulse

Einstein Copilot

Natural language questions

Automated insights

Upgrading Tableau Server does not provide generative AI.

Extensions and accelerators do not enable AI functionality.

Therefore, the customer must migrate from Tableau Server to Tableau Cloud to leverage generative AI.

Tableau AI/Pulse documentation stating availability only in Tableau Cloud.

Feature comparison charts showing generative AI unavailable on Tableau Server.


Question 8

SIMULATION

From the desktop, open the CC workbook. Use the US Population Estimates data source.

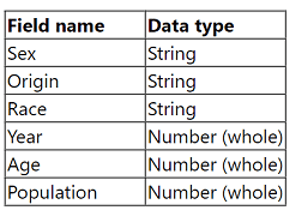
You need to shape the data in US Population Estimates by using Tableau Desktop. The data must be formatted as shown in the following table.

Open the Population worksheet. Enter the total number of records contained in the data set into the Total Records parameter.

From the File menu in Tableau Desktop, click Save.

Correct Answer: A. See the complete Steps below in Explanation
Explanation:

To shape the data in the 'US Population Estimates' data source and enter the total number of records into the 'Total Records' parameter in Tableau Desktop, follow these steps:

Open the CC Workbook and Access the Worksheet:

From the desktop, double-click on the CC workbook to open it in Tableau Desktop.

Navigate to the Population worksheet by selecting its tab at the bottom of the window.

Format and Shape the Data:

Ensure the data types match those specified in the requirements: Sex, Origin, Race as strings; Year, Age, Population as whole numbers.

To verify or change the data type, click on the dropdown arrow next to each field name in the Data pane and select 'Change Data Type' if necessary.

Calculate Total Number of Records:

Create a new calculated field named 'Total Records'. To do this, right-click in the Data pane and select 'Create Calculated Field'.

Enter the formula COUNT([Record ID]) or SUM([Number of Records]) depending on how the data source identifies each row uniquely.

Drag this new calculated field onto the worksheet to display the total number of records.

Enter the Value into the Total Records Parameter:

Locate the 'Total Records' parameter in the Data pane. Right-click on the parameter and select 'Edit'.

Manually enter the number displayed from the calculated field into the parameter, ensuring accuracy to meet the data shaping requirement.

Save Your Changes:

From the File menu, click 'Save' to ensure all your changes are stored.


Tableau Desktop Guide: Provides detailed instructions on managing data types, creating calculated fields, and updating parameters.

Tableau Data Shaping Techniques: Outlines effective methods for manipulating and structuring data for analysis.

This process will ensure the data in the 'US Population Estimates' is accurately shaped according to the specified format and that the total number of records is correctly calculated and entered into the designated parameter. This thorough approach ensures data integrity and accuracy in reporting.

Question 9

A consultant has a view using a table calculation to calculate percent of total Sales by Category. The consultant would like to filter out particular categories, but wants the percent of total calculation to remain steady even as they filter items in or out.

What should the consultant do to achieve the desired impact?

Correct Answer: D. Create a FIXED Level of Detail (LOD) expression, and then use that instead of the table calculation.
Explanation:

Comprehensive and Detailed Explanation From Exact Extract:

The key detail of the question:

''filter out particular categories, but wants the percent of total calculation to remain steady even as they filter items in or out.''

This means the percent of total must ignore filters.

Table calculations always operate after filters, except table calc filters like 'Filter on Table Calculation,' and after dimension filters, so filtering categories directly will change the denominator.

Tableau's documented solution for ''percent of total that does not change with filtering'' is:

Use a FIXED LOD to define the stable denominator

A FIXED LOD expression ''freezes'' the aggregation level and is unaffected by dimension filters unless explicitly added to context.

This allows the consultant to compute:

{ FIXED : SUM([Sales]) }

or

{ FIXED [Category] : SUM([Sales]) }

Then percent of total becomes:

SUM([Sales]) / { FIXED : SUM([Sales]) }

The FIXED LOD stores the total before filters are applied, ensuring the percent remains steady.

This is exactly what Tableau documentation explains under:

Level of Detail Expressions

LODs and Order of Operations

Using LODs to create filter-independent calculations

Thus, D is correct.

Why the other answers are wrong:

A. Context Filter

Context filters run before FIXED LODs but after raw data.

If Category is put into context, LOD totals would be reduced.

Table calculation totals still change because table calcs run near the bottom of the pipeline.

B. Data Source Filter

Data source filters remove rows before all table calculations and LODs.

This would make the percent of total incorrect, because filtered-out categories would physically be gone.

C. Aggregate Expression

An aggregate field alone does not solve the issue because it still respects dimension filters.


Question 10

A client creates a report and publishes it to Tableau Server where each department has its own user group set on the server. The client wants to limit visibility of

the report to the sales and marketing groups in the most efficient manner.

Which approach should the consultant recommend?

Correct Answer: A. Grant access to the report on the Tableau Server only to the members of sales and marketing user groups.
Explanation:

The most efficient way to limit report visibility to specific user groups on Tableau Server is to manage permissions directly on the server. By granting access to the report only to the sales and marketing user groups, the client ensures that only members of these groups can view the report. This method is straightforward and does not require the additional steps involved in setting up row-level security or user filters.