Limited-Time Offer: Enjoy 50% Savings! Ends in 00h 00m 00s Coupon code: 50OFF
Skip to content

Free Salesforce Certified Tableau Data Analyst Analytics-DA-201 Exam Questions

Page: 1 / 12 Total 174 questions

Want more questions? Get Premium Access.

Question 1

From Tableau Desktop you sign in lo a Tableau Server site.

What appears in the list of available data sources when you search for a published data source?

Correct Answer: C. All the data sources published to the site within the folders to which you have access
Explanation:

When you sign in to a Tableau Server site from Tableau Desktop and search for a published data source, you will see all the data sources published to the site within the folders to which you have access. You will not see data sources published to other sites or folders that you do not have permission to view. You can also filter your search by project, owner, or tag. Reference: https://help.tableau.com/current/pro/desktop/en-us/connect_basic.htm https://help.tableau.com/current/pro/desktop/en-us/connect_tableauserver.htm

When signed in to Tableau Server from Tableau Desktop, you'll only be able to see the data sources that have been published to the site and are within the folders that you have been granted access to. Tableau's permission and project structure mean that you won't see all data sources from the entire server unless you have permissions to do so.
Question 2

When a Data Analyst needs to format workbook settings, which options are available in the Format Workbook panel?

Correct Answer: A. Fonts and Lines

Question 3

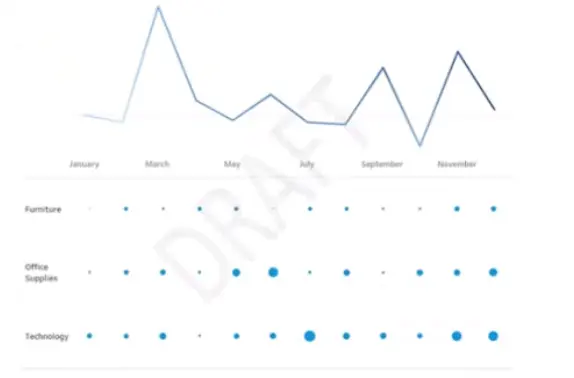
You want to add a draft watermark to a dashboard as shown in the following exhibit.

Which type of object should you use?

Correct Answer: A. Image
Explanation:

To add a draft watermark to a Tableau dashboard, you would use an image object. You can overlay this image across your dashboard, possibly with some transparency, to achieve the watermark effect without interfering with the readability of the dashboard content.

Question 4

Which syntax should a Data Analyst use to find the first purchase date per customer when Customer is not in the view?

Correct Answer: A. { FIXED [Customer ID] : MIN([Purchase Date]) }

Question 5

You subscribe to a view that delivers a daily email to your inbox.

You want to make the subscription available to other stakeholders.

What should you do?

Correct Answer: B. From the My Content overview page, modify the subscription.

Question 6

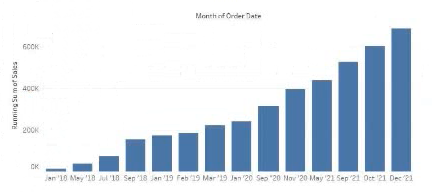
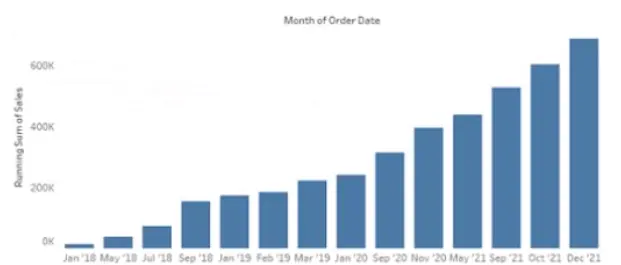
You have the following chart that shows the cumulative of sales from various dates.

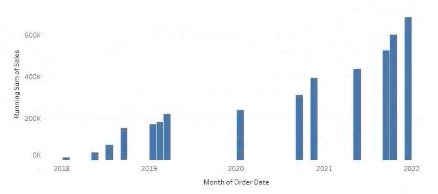
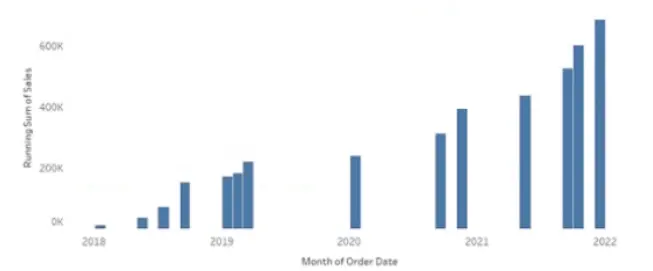
You want the months to appear as shown in the following chart.

What should you do?

Correct Answer: B. Convert the date to Continuous
Explanation:

To ensure the dates are shown in a continuous axis, you should convert the date to a continuous field. This will display the months in a sequence without any breaks, which is needed for showing a trend over time like the cumulative sum of sales.

Question 7

A Data Analyst creates the following story that contains two story points.

The analyst wants to change the story point format to show the current story point number out of the total number of story points.

Which Layout option should the analyst use?

Correct Answer: A. Arrows only

Question 8

A Data Analyst has the following chart that shows the cumulative volume of sales from various dates.

The analyst wants the months to appear as shown in the following chart.

What should the analyst do?

Correct Answer: C. Convert the date to Continuous

Question 9

You connect to a database server by using Tableau Prep. The database server has a data role named Role1.

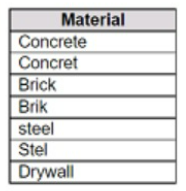
You have the following field in the data.

You need to apply the Role1 data role to the Material field.

Which two actions should you perform? Choose two.

Correct Answer: B. For the data type of the Material field, select Custom, and then select Role1.; C. From the More actions menu of Materials, select Group Values, and then select Spelling.
Explanation:

To apply a custom data role to a field, you need to select the data type of the field and then choose the data role from the list of available roles. This will validate the values in the field against the data role and mark any invalid values with a red exclamation mark. To fix the invalid values, you can use the Group Values option and select the Spelling algorithm, which will group values that are close in spelling and replace them with the most frequent value in the group. This will help you standardize the values in the Material field and match them with the Role1 data role.Reference:The information is based on the following sources:

Use Data Roles to Validate your Data - Tableau

New in Tableau Prep: Automatically identify data quality issues with Data Roles


Question 10

You want to connect a Tableau workbook to a dataset in a Microsoft Excel spreadsheet.

What should you do from Tableau Desktop?

Correct Answer: A. From the Data menu select New Data Source

Question 11

A Data Analyst has the following sets in a Tableau workbook:

Top N Customers

Customers of 2024

Top N Products

Sellers of 2024

Which two sets can the analyst combine? (Choose two.)

Correct Answer: B. Top N Customers; C. Customers of 2024

Question 12

In a dataset, you have a string field named Name that contains unnecessary semicolons.

Which function should you use to remove the semicolons from the Name field?

Correct Answer: C. REPLACE
Explanation:

The REPLACE function is used to replace all occurrences of a substring within a string with another substring. In this case, it can be used to remove the semicolons from the Name field by replacing them with an empty string. For example, REPLACE (''John;Doe'', '';'', '''') = ''JohnDoe''.Reference:The information is based on the following sources:

String Functions - Tableau

Remove special characters and add a semi colon in a word - Tableau


Question 13

A Data Analyst needs to calculate the percent of regional sales that each state contributes to. As a first step, the analyst needs to calculate total sales per region.

Which calculation should the analyst use to do this?

Correct Answer: A. {FIXED [Region]: SUM([Sales])}

Question 14

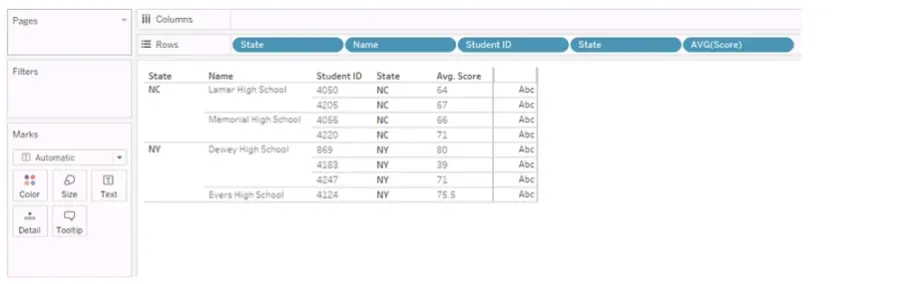
You have the following visualization.

You Create a table calculation named Rank_Score that has a formula of RANK(AVG([Score]), and you drag Rank_Score to Text on the Marks cards.

What is the Rank Score value for Student ID 4220?

Correct Answer: C. 6
Explanation:

To determine the Rank Score value for Student ID 4220, we look at the visualization provided and apply the table calculation of RANK(AVG([Score])). This function will rank the average scores in ascending order by default, with the lowest score receiving the rank of 1.

Based on the provided visualization, the scores for the students are as follows (from lowest to highest average score):

Student ID 4183: 39 (Rank 1)

Student ID 4220: 71 (Rank 6)

Student ID 4247: 71 (Rank 6, same score as ID 4220 so they share the same rank)

Student ID 4124: 75.5

Student ID 4050: 64

Student ID 4205: 67

Student ID 4056: 66

Since Student ID 4220 has an average score of 71, which is the third-highest score, it shares the rank with Student ID 4247. However, since Tableau ranks without gaps, the actual rank assigned is 6, considering that there are two students with a rank of 4 (due to the same average score being the second lowest), making the next rank number 6.

Note: The actual ranks for the highest scores are not provided, but they are not needed to determine the rank for Student ID 4220.

https://help.tableau.com/current/prep/en-us/prep_calculations.htm


Question 15

In a dataset, a Data Analyst has a string field named Name that contains unnecessary semicolons.

Which function should the analyst use to remove the semicolons from the Name field?

Correct Answer: D. REPLACE