
Limited-Time Offer: Enjoy 50% Savings! Ends in 00h 00m 00s Coupon code: 50OFF
Skip to content

Free VMware Advanced Deploy VMware NSX-T Data Center 3.x 3V0-41.22 Exam Questions

Page: 1 / 3 Total 16 questions

Want more questions? Get Premium Access.

Question 1

SIMULATION

Task 12

An issue with the Tampa web servers has been reported. You would like to replicate and redirect the web traffic to a network monitoring tool outside Of the NSX-T environment to further analyze the traffic.

You are asked to configure traffic replication to the monitoring software for your Tampa web overlay segments with bi-directional traffic using this detail:

Complete the requested configuration.

Notes: Passwords are contained in the user_readme.txt. This task is not dependent on other tasks. This task should take approximately 10 minutes to complete.

Correct Answer: A. See the Explanation part of the Complete Solution and step by step instructions
Explanation:

To configure traffic replication to the monitoring software for your Tampa web overlay segments with bi-directional traffic, you need to follow these steps:

Log in to the NSX Manager UI with admin credentials. The default URL is https://<nsx-manager-ip-address>.

Navigate to Networking > Segments and select the Tampa web overlay segment that you want to replicate the traffic from. For example, select Web-01 segment that you created in Task 2.

Click Port Mirroring > Set > Add Session and enter a name and an optional description for the port mirroring session. For example, enter Tampa-Web-Monitoring.

In the Direction section, select Bi-directional as the direction from the drop-down menu. This will replicate both ingress and egress traffic from the source to the destination.

In the Source section, click Set and select the VMs or logical ports that you want to use as the source of the traffic. For example, select Web-VM-01 and Web-VM-02 as the source VMs. Click Apply.

In the Destination section, click Set and select Remote L3 SPAN as the destination type from the drop-down menu. This will allow you to replicate the traffic to a remote destination outside of the NSX-T environment.

Enter the IP address of the destination device where you have installed the network monitoring software, such as 10.10.10.200.

Select an existing service profile from the drop-down menu or create a new one by clicking New Service Profile. A service profile defines the encapsulation type and other parameters for the replicated traffic.

Optionally, you can configure advanced settings such as TCP/IP stack, snap length, etc., for the port mirroring session.

Click Save and then Close to create the port mirroring session.
You have successfully configured traffic replication to the monitoring software for your Tampa web overlay segments with bi-directional traffic using NSX-T Manager UI.


Question 2

SIMULATION

Task 14

An administrator has seen an abundance of alarms regarding high CPU usage on the NSX Managers. The administrator has successfully cleared these alarms numerous times in the past and is aware of the issue. The administrator feels that the number of alarms being produced for these events is overwhelming the log files.

You need to:

* Review CPU Sensitivity and Threshold values.

Complete the requested task.

Notes: Passwords are contained in the user_readme.txt. This task is not dependent on other tasks. This task should take approximately 5 minutes to complete.

Correct Answer: A. See the Explanation part of the Complete Solution and step by step instructions
Explanation:

To review CPU sensitivity and threshold values, you need to follow these steps:

Log in to the NSX Manager UI with admin credentials. The default URL is https://<nsx-manager-ip-address>.

Navigate to System > Settings > System Settings > CPU and Memory Thresholds.

You will see the current values for CPU and memory thresholds for NSX Manager, NSX Controller, and NSX Edge. These values determine the percentage of CPU and memory usage that will trigger an alarm on the NSX Manager UI.

You can modify the default threshold values by clicking Edit and entering new values in the text boxes. For example, you can increase the CPU threshold for NSX Manager from 80% to 90% to reduce the number of alarms for high CPU usage. Click Save to apply the changes.

You can also view the historical data for CPU and memory usage for each component by clicking View Usage History.You can select a time range and a granularity level to see the usage trends and patterns over time


Question 3

SIMULATION

Task 6

You are asked to integrate NSX manager with LDAP to better control NSX administrators' roles and responsibilities. Ensure users can manage the NSX environment utilizing Active Directory login credentials.

You need to:

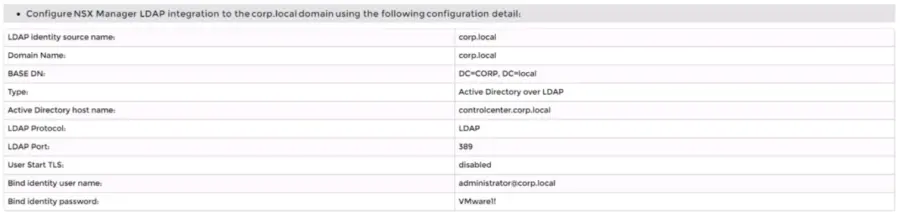
* Configure NSX Manager LDAP integration to the corp.local domain using the following configuration detail:

* Configure the user nsx-admin@corp.local Active Directory account as an Enterprise Admin access role.

Complete the requested task.

Notes:

Passwords are contained in the user_readme.txt. You may want to move to other tasks/steps while waiting for configuration changes to be applied. This task should take approximately 15 minutes to complete.

Correct Answer: A. See the Explanation part of the Complete Solution and step by step instructions
Explanation:

To integrate NSX Manager with LDAP to better control NSX administrators' roles and responsibilities, you need to follow these steps:

Log in to the NSX Manager UI with admin credentials. The default URL is https://<nsx-manager-ip-address>.

Navigate to System > User Management > LDAP and click Add Identity Source.

Enter a name for the identity source, such as corp.local.

Enter the domain name of your Active Directory server, such as DC=corp,DC=local.

Select Active Directory over LDAP as the type from the drop-down menu.

Click Set to configure LDAP servers. You can add up to three LDAP servers for failover support, to each domain.

Enter the hostname or IP address of your LDAP server, such as corpdcserver.corp.local.

Select LDAP as the protocol from the drop-down menu.

Enter the port number for the LDAP server, such as 389.

Click Connection Status to test the connection to the LDAP server. If successful, you will see a green check mark and a message saying ''Connection successful''.

Optionally, you can enable StartTLS to use encryption for the LDAP connection. To do this, toggle the Use StartTLS button and enter the certificate of the LDAP server in PEM format in the text box below.

Click Save to add the LDAP server.

Repeat steps 6 to 12 to add more LDAP servers if needed.

Enter the bind entry user name and password for the LDAP server, such as Administrator@corp.local and VMware1!.

Click Save to create the identity source.

Navigate to System > User Management > Users and Roles and click Add Role Assignment for LDAP.

Select corp.local as the domain from the drop-down menu.

Enter nsx-admin@corp.local in the search box and select it from the list that appears.

Select Enterprise Admin as the role from the drop-down menu.

Click Save to assign the role to the user.

You have successfully integrated NSX Manager with LDAP and configured nsx-admin@corp.local Active Directory account as an Enterprise Admin access role.


Question 4

SIMULATION

Task 8

You are tasked With troubleshooting the NSX IPSec VPN service Which has been reported down. Verify the current NSX configuration is deployed and resolve any issues.

You need to:

* Verify the present configuration as provided below:

Complete the requested task.

Notes: Passwords are contained in the user_readme.txt. This task is not dependent on another. This task Should take approximately 15 minutes to complete.

Correct Answer: A. See the Explanation part of the Complete Solution and step by step instructions
Explanation:

To troubleshoot the NSX IPSec VPN service that has been reported down, you need to follow these steps:

Log in to the NSX Manager UI with admin credentials. The default URL is https://<nsx-manager-ip-address>.

Navigate to Networking > VPN > IPSec VPN and select the IPSec VPN session that is down. You can identify the session by its name, local endpoint, remote endpoint, and status.

Click Show IPSec Statistics and view the details of the IPSec VPN session failure. You can see the error message, the tunnel state, the IKE and ESP status, and the statistics of the traffic sent and received.

Compare the configuration details of the IPSec VPN session with the expected configuration as provided below. Check for any discrepancies or errors in the parameters such as local and remote endpoints, local and remote networks, IKE and ESP profiles, etc.

If you find any configuration errors, click Actions > Edit and modify the parameters accordingly. Click Save to apply the changes.

If you do not find any configuration errors, check the connectivity and firewall rules between the local and remote endpoints. You can use ping or traceroute commands from the NSX Edge CLI to test the connectivity. You can also use show service ipsec command to check the status of IPSec VPN service on the NSX Edge.

If you find any connectivity or firewall issues, resolve them by adjusting the network settings or firewall rules on the NSX Edge or the third-party device.

After resolving the issues, verify that the IPSec VPN session is up and running by refreshing the IPSec VPN page on the NSX Manager UI.You can also use show service ipsec sp and show service ipsec sa commands on the NSX Edge CLI to check the status of security policy and security association for the IPSec VPN session.