Question 1
A team was assembled at a manufacturing plant in order to boost productivity. The team was tasked with producing as many widgets each day as possible. The results are shown in the graph.
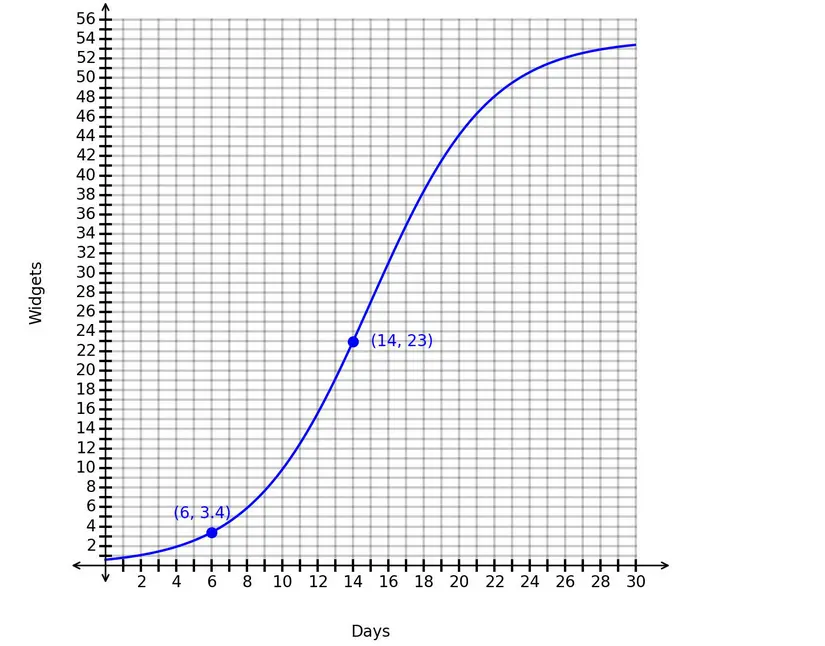
What is the correct interpretation of the average rate of change from day 6 to day 14?
Correct Answer:
B. The team increased production by an average of approximately 2.5 widgets each day.
Explanation:
The graph models the number of widgets the team can produce each day.
The horizontal axis represents:
The vertical axis represents:
The graph gives two labeled points:
and
The average rate of change is:
Substitute the values:
Rounded to the nearest tenth:
This means the team increased production by an average of approximately:
Therefore, the correct answer is: